A UC Davis Graduate Student Blog

Tag: COVID-19

Internet Accountability

Written by: Devan Murphy

Edited by: Jennifer Baily

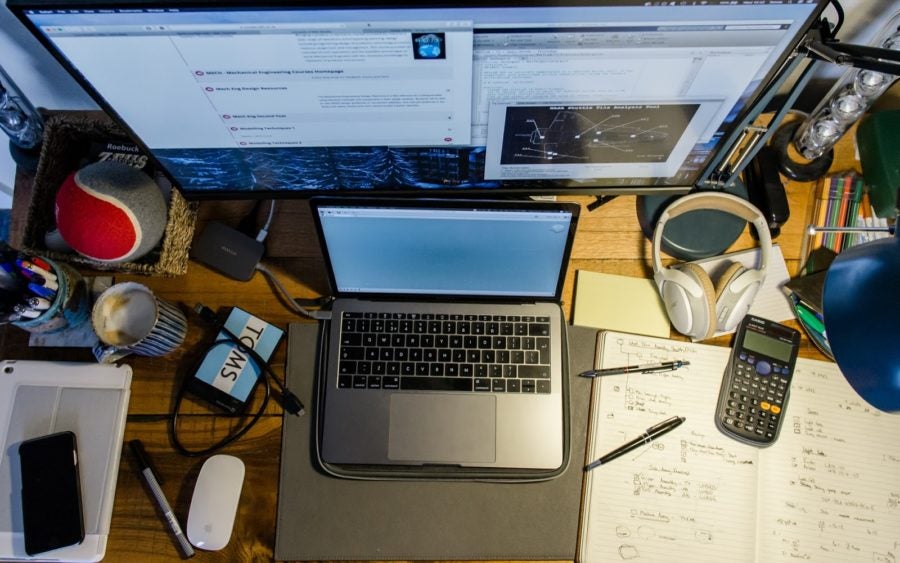
Due to the pandemic, most of us are spending more time in front of our screens. Honestly, I spend a lot more time on social media than I used to, and it has affected my mental health. No, it isn’t the dreaded FOMO (fear of missing out). It’s the posts from some of my friends and family that have shattered my perception of the people I thought I knew. As I scroll, I see an accumulation of conspiracy theories about COVID, unwillingness to help protect others by wearing a mask in public, and little empathy or consideration for the essential workers and medical professionals putting their life on the line while we sit at home. Although the internet is a valuable tool with a wealth of information and a method for connecting people, it can also be used for the complete opposite—disseminating falsehoods and driving a wedge between communities.

This weighs heavy on my mind and heart as people who helped raise me and shape who I am today share and legitimize misinformed views on the pandemic. But the information they insist on propagating results in behavior that goes against the very values I learned growing up. To see them posting harmful opinions and incorrect information feels like an attack on my profession. As a student in the Veterinary Student Training Program, I reside at an interface between the medical and basic science fields. To me, this situation is similar to clients who come into the clinic, ignore your professional opinion, and insist on telling you how to do your job because Dr. Google diagnosed their pet’s ailments for you. In the light of COVID, research scientists are now getting a taste of this frustration dealing with a population that is either ignorant or belligerently dismissive of facts (although climate change scientists have known this pain for a while now).

I do understand how the public could be confused. There is SO MUCH information out there, but this is what we deal with in science all the time. And as graduate students, I think we are exceptionally good at updating our point of view when we receive new data. I remember a conversation with a family member about grocery bags. He was annoyed about paper bags being brought back into fashion. It went something like this:

I don’t understand. We used to use paper bags, then they told us not to cut down trees, so we all switched to plastic. Now, everything is “Plastic is bad, plastic is ruining this environment.” So, which is it? We are supposed to go back to killing trees?

I tried to explain that as we get new information, we need to reimagine our behaviors. It is natural for scientists to understand that nothing is simple. There are always things we don’t know; we live on the frontier of the known and undiscovered. As we find new information and uncover confounding variables, we build them into our understanding or understand when to reject them. I wish it was easy as a superhero movie, where the bad guy is easily identifiable. But that’s not the real world. It is messy and problems are multifactorial, and clear straightforward solutions rarely exist. But here is the irony, in this situation, a common enemy does exist! Coronavirus. So, with a clear threat in sight, why are some people insistent on defying health experts instead unifying to defeat the pandemic?

Initially, who knew what to do? Wear a mask, don’t wear a mask? And unfortunately, with government leaders not always being the most reliable sources, downplaying the severity of the problem and being slow to take action, it can be very confusing for someone watching the news to know what actions to take. However, now it is clear this virus is very contagious, deadly, and masks help prevent transmission. Therefore, perpetuating misinformation and bashing public health guidelines is a safety concern.

So, as graduate students, a community versed in critical thinking and evaluating primary literature, is it part of our job to combat misinformation online? Is it our place? And what internal conflict does this pose to call out our family members or friends? Interestingly, I wanted a career in science because I thought it was the unbiased pursuit of facts, untainted by the subjectivity of the humanities. Why deal with people when numbers don’t lie. But numbers can lie. In the worst case, they are purposely manipulated(1), but even in the best of circumstances, statistics without context mean nothing. And without placing these numbers in the proper context, it is easy to misdirect the audience. As recent events have made perfectly clear, science is not devoid of these conflicts. Our science is funded by taxpayers to help the public, therefore, getting involved to make science interpretable and usable to the public is implied in that paycheck.

Leaders and officials seem to be catching up on the relevance of internet accountability. The United Nations started an initiative to provide reliable information about COVID(2) and some social media sites like Twitter began fact checking posts(3). But to do this, you need to critique the information. Scientists do this all the time with peer review, disclosing conflicts of interest, and discussing the limitations of their work. However, it takes time to go through and fight/debunk all of the misinformation. In contrast, it takes NO effort to make stuff up to support a false narrative. I’m lucky enough to still have my job, and I honestly don’t have the time to refute all the misinformation I come across. To some extent, it must be the responsibility of the individual to self-educate. Again, there is a wealth of information online.

While I strive to stress the importance of accountability online, I acknowledge that this may not be an entirely safe conversation as people feel attacked when you dispute their worldview. So much of science has been tied to politics, which becomes emotional quickly. Being rejected or cut off by loved ones may not be an option. But if possible, in the way that personally works best for you (1-on-1 conversations, public sharing of valid resources, etc.), I think we have some responsibility as a science community to stop the spread of misinformation. That doesn’t mean everyone will listen, but letting this information spread unchallenged, like the virus, is dangerous.

(For more information, about spotting misinformation and fighting it, check out Fleming’s article (4) )


  1.   Florida and Georgia facing scrutiny for their Covid-19 data reporting – CNN. https://www.cnn.com/2020/05/20/us/florida-georgia-covid-19-test-data/index.html.
  2.   Online training as a weapon to fight the new coronavirus. https://www.who.int/news-room/detail/07-02-2020-online-training-as-a-weapon-to-fight-the-new-coronavirus.
  3.   Twitter fact-checks tweets linking 5G and coronavirus – Business Insider. https://www.businessinsider.com/twitter-factchecks-tweets-5g-coronavirus-2020-6.
  4.   Fleming, N. Coronavirus misinformation, and how scientists can help to fight it. Nature 583, 155–156 (2020).


Organize Space and Time to Keep Sane in Isolation (Or Otherwise)

Like most (if not all) of us here at Bioscope, you may be struggling with how to remain productive while doing primarily everything in isolation. You may have even found yourself attending classes, working from home, and watching Netflix, all from the same, sunken, spot on your bed more times than you’re pleased to admit. Although this may have worked for the first few months of quarantine, by now you’ve probably noticed how unsustainable this habit really is. 

In the Youtube video “Lockdown Productivity: Spaceship You,” CGP Grey illustrates how living in such a disorganized, unstructured manner undermines our ability to maintain our individual “spaceships” by impairing our mental and physical well-being necessary for its operation. Learn the simple, though effective ways of keeping your sanity and maximizing your productivity when operating in a finite area by making the most of your space and blocking out areas to work, sleep, exercise, and couch (apparently couch is now a verb).

I truly believe these techniques are helpful no matter how small your functional area and regardless of our current coronavirus pandemic. I hope you think so too.


May your thirst for knowledge never be quenched, friends,

Nina


Resource suggestion made by: Yulong Liu

Edited by: Yulong Liu and Keith Fraga

Looking at case-number data for COVID-19

Written by: Keith Fraga

Edited by: Sydney Wyatt

The California shelter-in-place order due to COVID-19 has been in effect for over a month, with an uncertain end-date. Understanding how the disease is spreading by making predictions based on current data can help health officials in their decision on when to lift the order. There are a number of ways one can analyze the data on COVID-19 cases to model where the epidemic is heading.


Often, statistics on COVID-19 growth rate are given in terms of cumulative cases from the start of the epidemic. As an example using data from the Johns Hopkins COVID-19 resource site, the growth rate in the number of cases in the U.S. quickly surpassed Spain, which has the second highest growth rate, and it is still increasing. How this growth rate changes and ultimately decreases will be a major determining factor for the ending of shelter-in-place orders. Yet, it is difficult to model or uncover the trends in COVID-19 progression through a timeline of total infections, like in Figure 1, due to the exponential nature of the growth of total cases.


Figure 1: Total number of COVID-19 cases in U.S. (green) and Spain (red) based on data from Johns Hopkins.


In epidemiology, the spread of a disease undergoes an early period of exponential growth. Once the disease progresses to a point where no new infections can occur, the growth rate slows and the cumulative number of cases plateaus. This is called logistic growth, and an example of logistic growth is shown from the 2014-2016 Ebola outbreak data below. Looking at the steepest part in the curve in Figure 2, could we have known that the Ebola outbreak would plateau when it did?


Figure 2: Timeline for the cumulative growth of cases in the 2014-2016 Ebola outbreak. 


When there is only data from the middle of the logistic growth curve, it is challenging to predict when the curve will plateau. It is possible to make estimates of when an outbreak could plateau, but this requires looking at the data in a different way, described more below. The ability to predict and model this time to plateau, thereby estimating when the epidemic might be under control, will be a major factor in deciding when normal operations can resume.


‘The virus makes the timeline’ 


Dr. Anthony Fauci, the NIH infectious disease expert at the center of the U.S. response to COVID-19, gave some insight into interpretation of the outbreak. In a CNN interview on March 25th, Dr. Fauci explained that it is very difficult to know when we can return to normalcy. Further, our attempt to put a deadline on the virus is folly: “You don’t make the timeline, the virus makes the timeline.” How can we understand the virus’ timeline? This question exposes that time may not be the appropriate independent variable to track the epidemic’s progress. 


The growth of the virus depends on many factors, but fundamentally it depends on the number of currently infected patients that can transmit the virus. Mathematically, this is captured by modelling the infection growth rate as proportional to the number of currently infected. As more infected cases occur, the faster the outbreak spreads. Time – in days, weeks, or months – since the outbreak is an indirect way to track the virus’s progression. As more time elapses there are more transmission events, but how the outbreak grows is controlled by the number of infected patients. 


This argument indicates that time is not the best variable to be on the x-axis when looking at the outbreak’s timeline. Instead, we should look at the number of total infections versus the number of newly infected. As the number of new infections drop, the exponential nature of an epidemic begins to subside. On a (total infections) vs (new infections) plot, we can more readily see when the virus is slowing down.


Fortunately, people have already performed this analysis and made it freely available online. Figure 3 shows the growth of COVID-19 for the U.S, Spain, Italy, and China on a logarithmic scale. On a logarithmic scale, the tick-marks on the axes reflect a common multiplier, whereas on a linear scale the tick-marks reflect a common addition between numbers. Therefore on a logarithmic scale, the number of tick-marks between 1,000 and 10,000 is the same as the separation between 10,000 to 100,000 because both are separated by a multiplier of 10. Specifically, Figure 3 displays the logarithms of the absolute number of total and newly infected COVID-19 cases. China is experiencing a massive drop in new cases, and thus has reopened many parts of their country. Germany is experiencing perhaps a reliable downward trend in new infections. The U.S. has plateaued on the number of new infections, but this indicates that the outbreak is still growing, just not exponentially. This YouTube video describes how and why this analysis website was made, and is largely the motivation of this article.


Figure 3: Total confirmed cases vs new cases for US, Spain, Italy, and China (Source: https://aatishb.com/covidtrends/). 


Taking a deeper dive into the data, we can look at the cumulative cases over time for Germany and compare it to the plot in Figure 3. Figure 4 below illustrates how the drop in new cases (left plot) is a more discernible sign that the epidemic is slowing than the cumulative progression of the virus (right plot). 

Figure 4: Side-by-side view of two different ways to look at the COVID-19 epidemic in Germany. Source of plot on the right is: https://www.worldometers.info/coronavirus/country/germany/


We are in this together


By selecting all countries on the COVID trends website, COVID-19 progression exhibits very similar dynamics across the globe. This clearly shows this is a pandemic that severely impacts all countries. Countries and regions that are not yet overwhelmed can prepare based on experiences from the hotspot regions  


By looking at the progression of the epidemic in different ways, we can start learning more about how the epidemic grows and estimate when the number of cases starts to decrease. It is encouraging when watching, for example, Governor Cuomo of New York analyze the daily increases in deaths and new cases. While this analysis is not exactly the view we use in Figure 3 and on the Covid Trends website, examining daily increases in deaths and cases are useful barometers for the outbreak’s timeline. When those daily increases subside is when the exponential nature of the outbreak begins to plateau. Modeling and visualizing the pandemic will hopefully improve our preparedness for any future waves.  


Sources


  1. California, S. (2020). Stay home except for essential needs. Retrieved 28 April 2020, from https://covid19.ca.gov/stay-home-except-for-essential-needs/
  2. Cumulative Cases. (2020). Retrieved 28 April 2020, from https://coronavirus.jhu.edu/data/cumulative-cases
  3. Ma, J. (2020). Estimating epidemic exponential growth rate and basic reproduction number. Infectious Disease Modelling, 5, 129-141. doi: 10.1016/j.idm.2019.12.009
  4. Paul LeBlanc, C. (2020). Fauci: ‘You don’t make the timeline, the virus makes the timeline’ on relaxing public health measures. Retrieved 28 April 2020, from https://www.cnn.com/2020/03/25/politics/anthony-fauci-coronavirus-timeline-cnntv/index.html
  5. Covid Trends. (2020). Retrieved 28 April 2020, from https://aatishb.com/covidtrends/
  6. (2020). Retrieved 28 April 2020, from https://www.youtube.com/watch?v=54XLXg4fYsc
  7. Germany Coronavirus: 158,758 Cases and 6,126 Deaths – Worldometer. (2020). Retrieved 28 April 2020, from https://www.worldometers.info/coronavirus/country/germany/
  8. Sheridan, J. (2020). FILE: Slides from Cuomo’s 4/7 coronavirus briefing presentation. Retrieved 29 April 2020, from https://www.news10.com/news/ny-news/file-slides-from-cuomos-4-7-coronavirus-briefing-presentation/
  9. Caroline Kelly and Jen Christensen, C. (2020). CDC chief says there could be second, possibly worse coronavirus outbreak this winter. Retrieved 29 April 2020, from https://www.cnn.com/2020/04/21/politics/second-coronavirus-cdc-director-robert-redfield/index.html


Test Anxiety: COVID-19 Edition

Written by: Sydney Wyatt

Edited by: Jennifer Baily and Will Louie


If you’re like me, you’ve probably been panic-refreshing the Yolo County website for

Depiction of a swab collecting a sample from the back of the nasal cavity.

the newest case numbers as the COVID-19 pandemic continues. Case numbers continue to rise as testing capacity slowly increases, but social distancing appears to be flattening the curve in California. Disturbingly, there is still a huge backlog of samples to be tested and, currently, a high false negative rate. 


A nasal or throat swab is performed to get testable samples; according to one patient it “feels like they are swabbing your brain.” This sample is then shipped off to a laboratory to run a test to detect SARS-CoV-2 RNA. This involves RNA extraction, cDNA library prep, and finally RT-PCR to produce a band on an agarose gel that indicates a positive result. There is another method, approved by the FDA on March 13, that performs all these steps within a single automated instrument, but there is still doubt about whether it is better at extracting RNA without damage.


The FDA recently approved the use of Cellex’s antibody test, however antibody tests are not the best tool to diagnose illness. Antibodies develop to recognize and fight an invader, in this case the novel coronavirus; thus antibodies can only be detected during the late stages of symptomatic infection or after symptoms subside. It could help determine how many people actually had COVID-19, regardless if they tested negative or didn’t meet the testing requirements, however there is still debate whether antibody testing really works and demonstrates immunity. Antibody testing in California started on April 10. As of April 18, reports suggest that significantly more people have tested positive for antibodies than expected based on the laboratory test numbers.


While the initial World Health Organization (WHO) test implemented in January worked well for many countries, the Centers for Disease Control and Prevention (CDC) created its own test based on detecting different SARS-CoV-2 genes. While this test was shipped out starting February 6 after the CDC announced the first case on January 21, person-to-person spread was already occurring according to a CDC announcement on January 30 . The test was released under the Food and Drug Administration’s (FDA) emergency use authorization, meaning it was not vetted by the FDA prior to release. However,  problems with the negative control were reported as early as February 12. Labs found that the primers for the negative control were binding to each other to produce a false positive. The initial test batches with the faulty primers were recalled from general use, resulting in a bottleneck at the CDC lab in Atlanta, Georgia. The CDC approved modification of the test on February 26 on a lab-by-lab basis, although the test remains imperfect and there is a significant backlog due to the delay. This delay in testing between evidence of community spread on January 30th and the authorization of test adjustment on February 26th put the US almost a month behind on keeping the virus in check.  


While some county websites report the number of negative laboratory tests — like Santa Clara County in the Bay Area — there is currently a high false negative rate. Some reports indicate a 30% chance of a false negative, meaning 30% of those “negative” patients may actually have COVID-19. In some hotspots, this could significantly increase the number of positive cases. This inaccuracy can be caused by errors acquiring samples or during the testing process. The sample may not have enough genetic material. RNA is unstable and degrades easily, and the test process is difficult to troubleshoot due to complex steps. The antibody test may also give false negatives because not every patient will develop an antibody response as in the case of immunocompromised patients. RT-PCRs are notoriously finicky, yet they’re still the most sensitive testing method compared to antibody testing or culturing samples. 


As of April 2, there were a reported 60,000 pending tests in California alone; Quest Diagnostics — one of the largest private testing facilities in the country — reported a backlog of 80,000 tests on April 13. Again, these are RT-PCR tests that must be performed at private labs like Quest Diagnostics or university labs because the equipment is not widely available at the point of care. The testing bottleneck is further dependent on machine time and reagent availability. Accelerated results require the development of a sensitive sample-to-answer test that can be run at the point of care, similar to getting a flu test at the doctor’s office. 


A new point-of-care test from Abbott claims to detect infection in just 5 minutes using a specific proprietary machine already used in doctor’s offices across the country. It is important to note this test is also authorized by the FDA under emergency use authorization and will cease to be used when the authorization is revoked. Because it has not been officially vetted by the FDA, there are still doubts about its sensitivity.

While the backlog has been somewhat alleviated with 150,000 tests run per day last week, let’s keep it that way by staying home and physically distancing ourselves. Check out our articles about coronaviruses and maintaining your mental health while sheltering in place.

Maintaining Social Connections While Sheltering in Place

Hello there, from my apartment to yours.


As of this Thursday, the United States surpassed both China and Italy to become the new epicentre of the coronavirus pandemic. While the coronavirus continues to spread and millions of Americans self-isolate with no end in sight, many find themselves battling an inconspicuous enemy indoors: loneliness. The current practice of social distancing and sheltering in place is causing what some have termed a loneliness epidemic. As social creatures, this necessary practice can be difficult to sustain, since it prohibits us from interacting in person and holding social gatherings.


Loneliness also increases our risk for depression and anxiety, decreases our ability to respond to stress, and can weaken our immune systems, which effectively increases our susceptibility to contracting illnesses such as COVID-19. For these reasons, it’s important that we not only maintain calm and stop hoarding toilet paper and absurd amounts of perishable goods, but that we find unique ways of interacting and maintaining our social connections during these uncertain times. So, instead of panic scrolling through social media, consider listening to The Happiness Lab podcast by Yale professor Dr. Laurie Santos and learn how to recreate a sense of togetherness and keep calm in their Coronavirus bonus series.


Additionally, if you’re experiencing heightened levels of stress, anxiety or need assistance managing an anxiety disorder, you may find the following articles helpful:


https://www.helpguide.org/articles/anxiety/coronavirus-anxiety.htm 


Social distancing doesn’t have to mean social disengagement. Rather, this unique experience is an opportunity to come together and realize that, as cliche as it sounds, we’re all in this together. Afterall, it’s during times of crisis that it’s most important to remain connected.


  • Nina


Edited by Sydney Wyatt

Source suggested by Yulong Liu


For any content suggestions or general recommendations, please email to UCDBioScope@gmail.com and put science 2.0 in the title.


COVID-19: Keep Calm and Watch the Data

Written By: Ellen Osborn

Edited By: Jennifer Baily


Considering the massive media fever surrounding the current coronavirus outbreak, it might come as a surprise that most people are infected by one, if not multiple, coronaviruses during their lifetime. However, the current coronavirus outbreak is much more than just another flu.

Coronaviruses are a large family of viruses, of which several members cause mild to moderate upper-respiratory tract illnesses in humans, which account for 10% to 30% of these types of infections in adults. These endemic human coronaviruses (HCoVs) are considered inconsequential pathogens incapable of causing global epidemics. Until the early 2000s, HCoVs received little attention. 

Figure 1: The recent outbreaks of coronavirus-caused diseases known to infect humans (COVID-19 numbers are confirmed and as reported by China).

This changed when two novel coronaviruses (nCoVs) jumped from their animal reservoirs into humans and caused the Severe Acute Respiratory Syndrome (SARS) outbreak in 2002 and then Middle East Respiratory Syndrome (MERS) outbreak in 2012. Together, the SARS coronavirus (SARS-CoV) and MERS coronavirus (MERS-CoV) resulted in over ten thousand confirmed cases and 1640 deaths. The international panic brought about by these coronavirus outbreaks was crippling. In response, the World Health Organization (WHO) placed SARS-CoV and MERS-CoV on its Priority Pathogen list in an effort to galvanize research into nCoV biology as well as providing countermeasures to contain future outbreaks. 

Just two years later, an outbreak of an nCoV began in Wuhan, China. This nCoV is officially named SARS-CoV-2 due to preliminary analyses that identified genetic similarities to the 2002 SARS-CoV. Because the official name references SARS, the WHO shortly began referring to the virus as “the virus responsible for coronavirus disease 2019 ,” or COVID-19, in order to prevent unnecessary panic in populations affected by the 2002 SARS outbreak. 

The strong similarities between the COVID-19 coronavirus and SARS-CoV will undoubtedly assist in preventing and treating COVID-19. However, coronaviruses remain one of the least understood family of viruses due to their exceptionally large genome and proteome, and as a consequence, the complexity of the virus’ interactions with hosts. Here at the University of California, Davis, the California National Primate Research Center and Center for Immunology and Infection Diseases are working to establish a rhesus macaque model of COVID-19, which will be fundamental in understanding viral dissemination and age-related differences in COVID-19 disease progression. Additionally, the Interdisciplinary Research & Strategic Initiatives division of the Office of Research is coordinating the campus’ response to COVID-19 research funding opportunities and established the UC Davis COVID-19 Research Working Group to enable efficient sharing of resources, information, and to connect potential collaborates across UC Davis.

As an average news consumer, it has been difficult to pinpoint the exact level of concern COVID-19 merits. At the beginning of March, the WHO recorded 127 cases of COVID-19 in the United States – nine of which were fatal – and that community spread was beginning to occur in several locations. The CDC also received heavy blowback for an uncharacteristically slow response and subsequent release of a faulty test kit. Is the United States destined for an uncontrolled spread of coronavirus? Some are saying no and point to a more encouraging trend emerging from China in recent weeks. Dr. Bruce Aylward, an expert from the WHO, recently returned from a two-week trip to China to assess the state of the coronavirus outbreak after the country’s initial response garnered a storm of anger from its citizens and the rest of the world and relayed optimistic data. At the end of January, China was diagnosing over 2000 new cases per day with 31 provinces on red alert, but by early March, there were less than 100 new cases per day with 24 provinces down to yellow or green alert. Dr. Aylward says that this data is a good sign, and that with appropriate government-sanctioned public health measures and public cooperation, COVID-19 can still be contained globally, despite less than encouraging initial government responses.

Other world leaders and health professionals are suspect of China’s severe approach to contain COVID-19, questioning the effectiveness of essentially putting hundreds of millions of people, regardless of their health, on house arrest. Michael T. Osterholm, director of the Center of Infectious Disease Research and Policy at the University of Minnesota, wrote in a recent New York Times op-ed that although China did a remarkable job of slowing the progress of the outbreak, he is not convinced that it is sustainable and asks what others are asking: did the Chinese actually contain the virus, or have they just suppressed it? Only time will tell whether the virus will continue to spread when the Chinese people return to work and school. Even if the virus was successfully contained, it is hard to believe that China’s cordon sanitaire* could be reproducible in other countries that do not have the same surveillance infrastructure as China and whose citizens are not accustomed to authoritative government action.

Though the data are incomplete and public health measures in the United States have yet to be fully formed and delivered, it seems fair to say that social distancing is essential to contain COVID-19. Containment might require people to make sacrifices they are unaccustomed to, like working from home and canceling social events, but these are ultimately small sacrifices in the face of a global pandemic. In the meantime, instead of trying to gauge how concerned we should be from the headlines, it might be better to take the advice of New York Times reporter Donald McNield who has covered disease outbreaks since 2002: “don’t panic; watch the data.” As graduate students, we are uniquely qualified to practice this advice and communicate the data to our community.

Figure 2: Check Financial Times for the live version of this figure.

For our UC Davis readers, find campus updates here.

California state updates can be found here

CDC updates can be found here

WHO updates can be found here


Resources: 

The WHO daily situation reports. 

Cohen, J.; Powderly, WG. Infectious diseases. 2nd edn.. Mosby; New York: 2004.

de Wilde, Adriaan H., et al. “Host factors in coronavirus replication.” Roles of Host Gene and Non-coding RNA Expression in Virus Infection. Springer, Cham, 2017. 1-42.

de Wit, Emmie, et al. “SARS and MERS: recent insights into emerging coronaviruses.” Nature Reviews Microbiology 14.8 (2016): 523.

Li, Yan‐Chao, Wan‐Zhu Bai, and Tsutomu Hashikawa. “The neuroinvasive potential of SARS‐CoV2 may be at least partially responsible for the respiratory failure of COVID‐19 patients.” Journal of Medical Virology (2020).

Paules, Catharine I., Hilary D. Marston, and Anthony S. Fauci. “Coronavirus infections—more than just the common cold.” Jama 323.8 (2020): 707-708.

*A cordon sanitaire is the establishment of a quarantine zone where both sick and healthy people are not allowed to leave. 

Powered by WordPress & Theme by Anders Norén