A UC Davis Graduate Student Blog

Author: Staff Page 2 of 3

Looking at case-number data for COVID-19

Written by: Keith Fraga

Edited by: Sydney Wyatt

The California shelter-in-place order due to COVID-19 has been in effect for over a month, with an uncertain end-date. Understanding how the disease is spreading by making predictions based on current data can help health officials in their decision on when to lift the order. There are a number of ways one can analyze the data on COVID-19 cases to model where the epidemic is heading.


Often, statistics on COVID-19 growth rate are given in terms of cumulative cases from the start of the epidemic. As an example using data from the Johns Hopkins COVID-19 resource site, the growth rate in the number of cases in the U.S. quickly surpassed Spain, which has the second highest growth rate, and it is still increasing. How this growth rate changes and ultimately decreases will be a major determining factor for the ending of shelter-in-place orders. Yet, it is difficult to model or uncover the trends in COVID-19 progression through a timeline of total infections, like in Figure 1, due to the exponential nature of the growth of total cases.


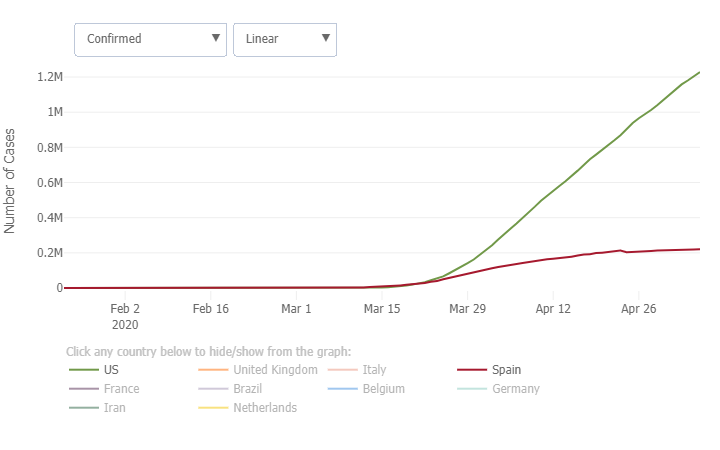
Figure 1: Total number of COVID-19 cases in U.S. (green) and Spain (red) based on data from Johns Hopkins.


In epidemiology, the spread of a disease undergoes an early period of exponential growth. Once the disease progresses to a point where no new infections can occur, the growth rate slows and the cumulative number of cases plateaus. This is called logistic growth, and an example of logistic growth is shown from the 2014-2016 Ebola outbreak data below. Looking at the steepest part in the curve in Figure 2, could we have known that the Ebola outbreak would plateau when it did?


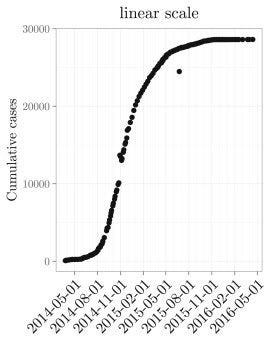
Figure 2: Timeline for the cumulative growth of cases in the 2014-2016 Ebola outbreak. 


When there is only data from the middle of the logistic growth curve, it is challenging to predict when the curve will plateau. It is possible to make estimates of when an outbreak could plateau, but this requires looking at the data in a different way, described more below. The ability to predict and model this time to plateau, thereby estimating when the epidemic might be under control, will be a major factor in deciding when normal operations can resume.


‘The virus makes the timeline’ 


Dr. Anthony Fauci, the NIH infectious disease expert at the center of the U.S. response to COVID-19, gave some insight into interpretation of the outbreak. In a CNN interview on March 25th, Dr. Fauci explained that it is very difficult to know when we can return to normalcy. Further, our attempt to put a deadline on the virus is folly: “You don’t make the timeline, the virus makes the timeline.” How can we understand the virus’ timeline? This question exposes that time may not be the appropriate independent variable to track the epidemic’s progress. 


The growth of the virus depends on many factors, but fundamentally it depends on the number of currently infected patients that can transmit the virus. Mathematically, this is captured by modelling the infection growth rate as proportional to the number of currently infected. As more infected cases occur, the faster the outbreak spreads. Time – in days, weeks, or months – since the outbreak is an indirect way to track the virus’s progression. As more time elapses there are more transmission events, but how the outbreak grows is controlled by the number of infected patients. 


This argument indicates that time is not the best variable to be on the x-axis when looking at the outbreak’s timeline. Instead, we should look at the number of total infections versus the number of newly infected. As the number of new infections drop, the exponential nature of an epidemic begins to subside. On a (total infections) vs (new infections) plot, we can more readily see when the virus is slowing down.


Fortunately, people have already performed this analysis and made it freely available online. Figure 3 shows the growth of COVID-19 for the U.S, Spain, Italy, and China on a logarithmic scale. On a logarithmic scale, the tick-marks on the axes reflect a common multiplier, whereas on a linear scale the tick-marks reflect a common addition between numbers. Therefore on a logarithmic scale, the number of tick-marks between 1,000 and 10,000 is the same as the separation between 10,000 to 100,000 because both are separated by a multiplier of 10. Specifically, Figure 3 displays the logarithms of the absolute number of total and newly infected COVID-19 cases. China is experiencing a massive drop in new cases, and thus has reopened many parts of their country. Germany is experiencing perhaps a reliable downward trend in new infections. The U.S. has plateaued on the number of new infections, but this indicates that the outbreak is still growing, just not exponentially. This YouTube video describes how and why this analysis website was made, and is largely the motivation of this article.


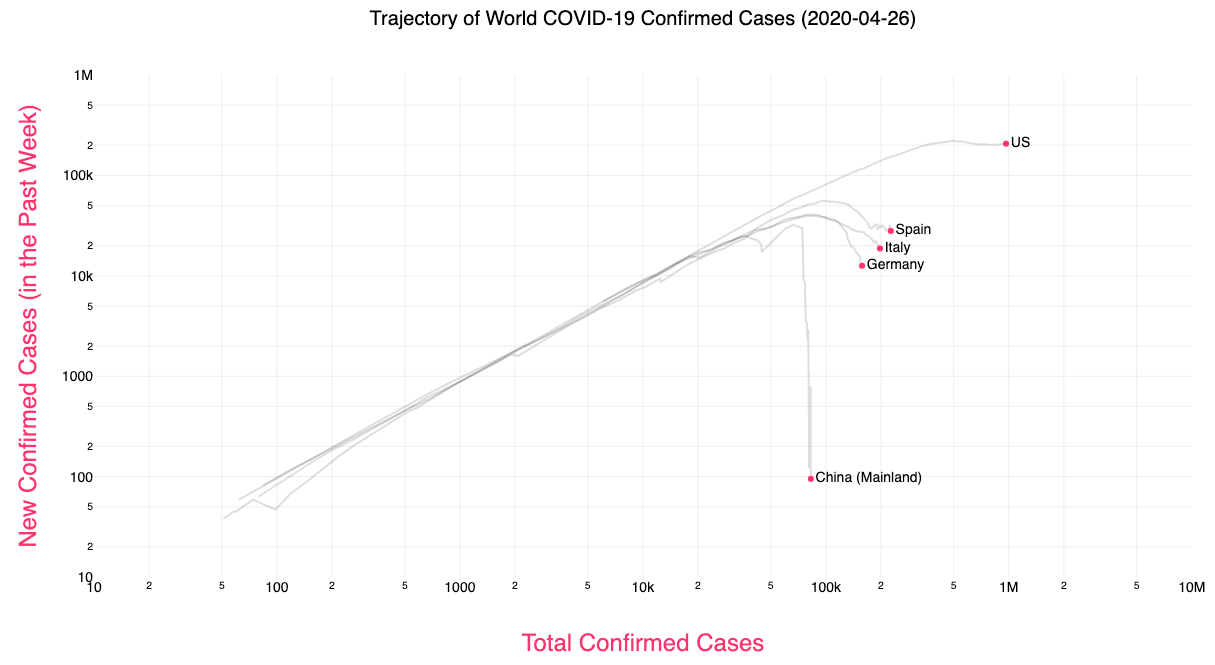
Figure 3: Total confirmed cases vs new cases for US, Spain, Italy, and China (Source: https://aatishb.com/covidtrends/). 


Taking a deeper dive into the data, we can look at the cumulative cases over time for Germany and compare it to the plot in Figure 3. Figure 4 below illustrates how the drop in new cases (left plot) is a more discernible sign that the epidemic is slowing than the cumulative progression of the virus (right plot). 

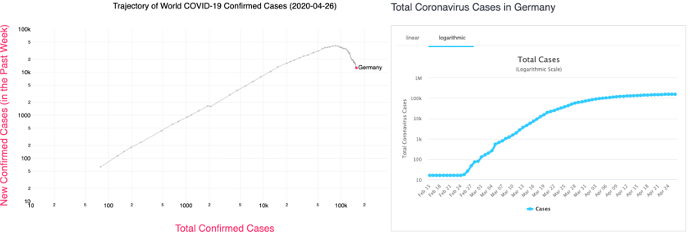
Figure 4: Side-by-side view of two different ways to look at the COVID-19 epidemic in Germany. Source of plot on the right is: https://www.worldometers.info/coronavirus/country/germany/


We are in this together


By selecting all countries on the COVID trends website, COVID-19 progression exhibits very similar dynamics across the globe. This clearly shows this is a pandemic that severely impacts all countries. Countries and regions that are not yet overwhelmed can prepare based on experiences from the hotspot regions  


By looking at the progression of the epidemic in different ways, we can start learning more about how the epidemic grows and estimate when the number of cases starts to decrease. It is encouraging when watching, for example, Governor Cuomo of New York analyze the daily increases in deaths and new cases. While this analysis is not exactly the view we use in Figure 3 and on the Covid Trends website, examining daily increases in deaths and cases are useful barometers for the outbreak’s timeline. When those daily increases subside is when the exponential nature of the outbreak begins to plateau. Modeling and visualizing the pandemic will hopefully improve our preparedness for any future waves.  


Sources


  1. California, S. (2020). Stay home except for essential needs. Retrieved 28 April 2020, from https://covid19.ca.gov/stay-home-except-for-essential-needs/
  2. Cumulative Cases. (2020). Retrieved 28 April 2020, from https://coronavirus.jhu.edu/data/cumulative-cases
  3. Ma, J. (2020). Estimating epidemic exponential growth rate and basic reproduction number. Infectious Disease Modelling, 5, 129-141. doi: 10.1016/j.idm.2019.12.009
  4. Paul LeBlanc, C. (2020). Fauci: ‘You don’t make the timeline, the virus makes the timeline’ on relaxing public health measures. Retrieved 28 April 2020, from https://www.cnn.com/2020/03/25/politics/anthony-fauci-coronavirus-timeline-cnntv/index.html
  5. Covid Trends. (2020). Retrieved 28 April 2020, from https://aatishb.com/covidtrends/
  6. (2020). Retrieved 28 April 2020, from https://www.youtube.com/watch?v=54XLXg4fYsc
  7. Germany Coronavirus: 158,758 Cases and 6,126 Deaths – Worldometer. (2020). Retrieved 28 April 2020, from https://www.worldometers.info/coronavirus/country/germany/
  8. Sheridan, J. (2020). FILE: Slides from Cuomo’s 4/7 coronavirus briefing presentation. Retrieved 29 April 2020, from https://www.news10.com/news/ny-news/file-slides-from-cuomos-4-7-coronavirus-briefing-presentation/
  9. Caroline Kelly and Jen Christensen, C. (2020). CDC chief says there could be second, possibly worse coronavirus outbreak this winter. Retrieved 29 April 2020, from https://www.cnn.com/2020/04/21/politics/second-coronavirus-cdc-director-robert-redfield/index.html


Resources to Expand and Strengthen Your Skill Set

Would you like to supplement what you’ve learned in a previous course or a legitimate way to expand your expertise? Check out these nifty online resources sure to assist you in your academic and professional endeavors.


Coursera is an online learning platform brimming with educational opportunities. Browse through thousands of free online courses from a plethora of disciplines taught by reputable professors from distinguished universities and companies. Through Coursera, you can even obtain certificates and degrees proven to increase salaries and marketability, although these features require payment. Fear not, as payment for these features is very affordable. If money is still an issue, you can try applying for financial aid and scholarships offered through the platform itself.


If you’ve taken a computer programming or data science class but were left unsatisfied with your handle on the subject, consider signing up for a workshop organized by The Carpentries project. The Carpentries is a non-profit, community initiative based in California that strives to provide dependable and consistent fundamental computational and data science skills globally using evidence-based teaching practices.


If you can’t afford to pay for a Carpentries workshop, that’s okay; the UC Davis students, faculty, and staff of the College of Biological Sciences have you covered. They’ve graciously compiled these Interdisciplinary Tutorial Resources for those in need of some additional guidance in the areas of R/Rstudio, Python, Statistics, Machine Learning/AI, Genomics, and Light and Electron Microscopy.


May your thirst for knowledge never be quenched,


Nina


Resource suggestions made by: Yulong Liu, Ellen Osborn, and Sydney Wyatt


Edited by: Yulong Liu and Sydney Wyatt

Test Anxiety: COVID-19 Edition

Written by: Sydney Wyatt

Edited by: Jennifer Baily and Will Louie


If you’re like me, you’ve probably been panic-refreshing the Yolo County website for

Depiction of a swab collecting a sample from the back of the nasal cavity.

the newest case numbers as the COVID-19 pandemic continues. Case numbers continue to rise as testing capacity slowly increases, but social distancing appears to be flattening the curve in California. Disturbingly, there is still a huge backlog of samples to be tested and, currently, a high false negative rate. 


A nasal or throat swab is performed to get testable samples; according to one patient it “feels like they are swabbing your brain.” This sample is then shipped off to a laboratory to run a test to detect SARS-CoV-2 RNA. This involves RNA extraction, cDNA library prep, and finally RT-PCR to produce a band on an agarose gel that indicates a positive result. There is another method, approved by the FDA on March 13, that performs all these steps within a single automated instrument, but there is still doubt about whether it is better at extracting RNA without damage.


The FDA recently approved the use of Cellex’s antibody test, however antibody tests are not the best tool to diagnose illness. Antibodies develop to recognize and fight an invader, in this case the novel coronavirus; thus antibodies can only be detected during the late stages of symptomatic infection or after symptoms subside. It could help determine how many people actually had COVID-19, regardless if they tested negative or didn’t meet the testing requirements, however there is still debate whether antibody testing really works and demonstrates immunity. Antibody testing in California started on April 10. As of April 18, reports suggest that significantly more people have tested positive for antibodies than expected based on the laboratory test numbers.


While the initial World Health Organization (WHO) test implemented in January worked well for many countries, the Centers for Disease Control and Prevention (CDC) created its own test based on detecting different SARS-CoV-2 genes. While this test was shipped out starting February 6 after the CDC announced the first case on January 21, person-to-person spread was already occurring according to a CDC announcement on January 30 . The test was released under the Food and Drug Administration’s (FDA) emergency use authorization, meaning it was not vetted by the FDA prior to release. However,  problems with the negative control were reported as early as February 12. Labs found that the primers for the negative control were binding to each other to produce a false positive. The initial test batches with the faulty primers were recalled from general use, resulting in a bottleneck at the CDC lab in Atlanta, Georgia. The CDC approved modification of the test on February 26 on a lab-by-lab basis, although the test remains imperfect and there is a significant backlog due to the delay. This delay in testing between evidence of community spread on January 30th and the authorization of test adjustment on February 26th put the US almost a month behind on keeping the virus in check.  


While some county websites report the number of negative laboratory tests — like Santa Clara County in the Bay Area — there is currently a high false negative rate. Some reports indicate a 30% chance of a false negative, meaning 30% of those “negative” patients may actually have COVID-19. In some hotspots, this could significantly increase the number of positive cases. This inaccuracy can be caused by errors acquiring samples or during the testing process. The sample may not have enough genetic material. RNA is unstable and degrades easily, and the test process is difficult to troubleshoot due to complex steps. The antibody test may also give false negatives because not every patient will develop an antibody response as in the case of immunocompromised patients. RT-PCRs are notoriously finicky, yet they’re still the most sensitive testing method compared to antibody testing or culturing samples. 


As of April 2, there were a reported 60,000 pending tests in California alone; Quest Diagnostics — one of the largest private testing facilities in the country — reported a backlog of 80,000 tests on April 13. Again, these are RT-PCR tests that must be performed at private labs like Quest Diagnostics or university labs because the equipment is not widely available at the point of care. The testing bottleneck is further dependent on machine time and reagent availability. Accelerated results require the development of a sensitive sample-to-answer test that can be run at the point of care, similar to getting a flu test at the doctor’s office. 


A new point-of-care test from Abbott claims to detect infection in just 5 minutes using a specific proprietary machine already used in doctor’s offices across the country. It is important to note this test is also authorized by the FDA under emergency use authorization and will cease to be used when the authorization is revoked. Because it has not been officially vetted by the FDA, there are still doubts about its sensitivity.

While the backlog has been somewhat alleviated with 150,000 tests run per day last week, let’s keep it that way by staying home and physically distancing ourselves. Check out our articles about coronaviruses and maintaining your mental health while sheltering in place.

Diversity in STEM Conference: An Interview and Reflection

Written by: Aiyana Emigh

Edited by: Keith Fraga


Note: Interwoven into this article are parts of an interview held on Feb 12th with Alexus Roberts, third-year PhD candidate in Population Biology, who was one of the lead organizers for the Diversity in STEM Conference.


In the midst of university controversy over the valuation of faculty diversity statements in their application process, the students of UC Davis held their newly-expanded, annual Diversity in STEM Conference (DISC) on January 25th with the purpose of “[honoring] the progress that has been made towards diversity and inclusion on campus, in the industry, and beyond.” 


Me: How well did the events of the day meet your mission? Did you achieve everything you wanted to achieve?

Alexus: I think based on our mission and our purpose statements we were talking about bringing together marginalized students to create community… and [talk] about the barriers to marginalized students and how you overcome them. I think the panel alone addressed that. And then, honoring the progress that has been made on campus… those are really broad goals. We definitely addressed them but I think we have to collect feedback from people [over the next] couple years and … see if that [led] to internships or job opportunities. I think as a committee one of our goals is to create a pipeline for marginalized students to graduate from higher education on their own terms… That [will take] time.


Held in the ARC Ballrooms and filled with more food than everyone could eat, the day began with breakfast and time to mingle before sitting down for the first speaker. After splitting a cinnamon roll with the keynote speaker, Dr. Renetta Tull, because we both had a craving we didn’t want to indulge, I sat down to listen to a very inspiring morning of speeches and panel discussions. 


Dr. Tull’s keynote address “Joy in the Journey” outlined the meandering path she took to her current position as Vice Chancellor of Diversity, Equity and Inclusion. The title was inspired by a quote from Representative Ayanna Pressley of Massachusetts, “It’s alright to stand in joy…joy is a necessary act of resistance.” It was very clear from her talk that Dr. Tull intimately understands the mental health concerns of graduate students and personally experienced the bias and discrimination women and minorities face, especially within the STEM community, and wants to be an ally to current students who may be struggling. 


Her story highlighted that success may not always look like we imagined it to and we may need to rethink our trajectory, but if we focus on the problems that are important to us we can find our way. One part Dr. Tull shared that stuck in my mind was a section of a poem she wrote on her flight home from a speaking engagement on diversity in Latin America: 

I am out of the box, 

the voice you didn’t know you needed to hear, 

together we are better, 

join me in the struggle to lift others up.

This consistent message throughout her story was the need for resilience, mentorship, and community. “[Reshaping] environments [people exist in] can mean something. It can inspire.” We need to choose to surround ourselves with people who are going to build us up. 


Me: What did you enjoy most about the day?

Alexus: There was a certain point during the luncheon where I had to go up [on stage] and tell everyone … ‘here is what’s happening.’ And just seeing everyone out there talking, smiling and laughing, seeing them lining up to talk to the panelists–it was really cool. [The DISC Organizers] are really making a difference and making a space for community … [and] connections. 


This message of community was echoed throughout the remaining morning sessions. Two panels – “Transitioning from College to the Workplace” and “Navigating the Workplace in STEM” – consisted of four speakers* each plus the lead panelist and moderator, Dr. Devin Horton. I could fill up several pages with the stories, advice, clarifications, solidarity and support the speakers packed into this hour, but to sum it up through quotes by the panelists:


  1. “Don’t measure by how much help someone appears to need.” –Lakshmi Sharma
  2. “The system is not fair and you have to find ways to change it, but don’t let it compromise your mental health.” –Colleen Bronner
  3. “There is so much [we] don’t know and don’t realize. Mentors can help you figure out how prepared you are.” –Gwladys Keubon
  4. On dealing with imposter syndrome, adopt the attitude: “I don’t know it yet, but I will.” –Amanda Dang
  5. “Resources may have been there but not the knowledge of them or the thought I deserved them. Have the confidence to go after them. Move the resources closer to you.” –Barbara Blanco
  6. “My culture tells you to be humble and that if you put your head down and work someone will notice you. This doesn’t work. [We need to] encourage people who are doing well and give them the opportunity to be leaders. Doors open up from achievements but also from advertising them.” –Carlos Gonzalez
  7. “Always be willing to learn and grow no matter what position you are in.” –Linda Finley
  8. “The reimbursement system is b***s***.” –Crystal Rogers 


An important distinction made during this time that I don’t think is discussed enough is on the difference between mentors and sponsors. A mentor helps you through advice and support. A sponsor advocates for you, even when you aren’t in the room. During the Q&A, one student attendee spoke about his struggle with finding a sponsor. The response: Sponsorship requires trust; Invest time in them, in who they are and their personality. The truth is that these sponsor-sponsee relationships are investments and, when networking, the number one piece of advice someone can give you is to find what you can do for your sponsor. It’s not just about what they can do for you. Demonstrating what you can do for the sponsor and your developing relationship with them will encourage the sponsor to advocate for you when you are not in the room. 


Me: What challenges did you face?

Alexus: Everyone [who was planning this event] is a student. So making sure that we actually made time for all of this was difficult. I definitely know there was a good two weeks when I got back from winter break where I didn’t focus on anything else besides this conference. We had already been planning since June, but [this] was the time when everyone needed updates … Additionally, [the organizers] are strong visionaries and leaders … and when you have [many of these people] in a room together, there is a lot of back and forth about how we [wanted] things to be––making sure that everyone was happy with how this looked can cause tension sometimes. The last thing was student turnout. We had 100 students come which was incredible. And all the students that were there really gave some high praise and admiration for the conference overall. But, to put in all that work and have 100 of the 200 that RSVPd not show up was [frustrating]. I think people are busy but if you are involved in planning an event then, you know, that handful of people not showing up is difficult. 


Another important discussion graduate students need to have is on the balance between hard work and mental health. So many students come in and acquiesce to professors’ expectations or demands, or they don’t feel like they have the right to pursue their interests outside of their lab work. Complicated by a power imbalance and centuries of tradition, the relationship between PI and student can be wonderfully supportive and productive but it can also be very contentious


Also asked in the Q&A was how to bridge the gap between working hard and maintaining mental health. The response: Taking care of yourself improves your work. Set boundaries and priorities, and commit to your hobbies. Most importantly: Learn to say no. “No” is a complete sentence. This advice should be given to every graduate student walking on to campus and will continue to be relevant as we move on in our career. Women and minorities are often asked to contribute more of their time on average to serve on committees and be present because of these efforts to diversify. This means the people often struggling hardest to stay afloat are the same people with more pressure and responsibilities.


Me: One point brought up in the panels was how people may have access to resources but didn’t know they were there. What are your thoughts on trying to make all the resources known to people, whether on campus or in general?

Alexus: I think it’s difficult because we have all these different mediums to connect with students and make sure that what you have to offer is out there. The people providing the resources… have to do their part to advertise it and make it accessible to people… I know it can be very overwhelming to try to look for all those things and when you are struggling it is very hard to be like ‘I can go and I can do this thing.’ 


After the lunch break and conversations with the interesting women at my table, we split up for an afternoon of workshops. There were three options for each of the two workshop sessions divided into two tracks: graduate and professional. For my first session, I attended the “Conflict Management”  professional track option led by two student interns from the Center for Leadership and Learning which began with an exercise where we individually chose four words that we associated with the word “power.” I chose (1). Money, (2) Politics, (3) Corruption, and (4) Confidence. We then paired up and were tasked with narrowing down our combined eight words back down to four by advocating for more of our words to be included in the final set than our partner’s. Then, our pairs combined with another group and repeated the process but this time arguing for more of the other group’s words to be included in the final set. This activity was accompanied by debrief questions about what it revealed about your approach to conflict and was followed up by a quick conflict management style assessment similar to the one linked here that assigned an animal (I’m an owl apparently) to different approaches to conflict. The last session before the career fair, ”Stories from Professionals,” consisted of guest speakers talking about their career paths and experiences. Their advice reiterated many points made during the morning panels but could be boiled down to: reach out and make as many connections as possible. Not only do opportunities open when you meet new people but it exposes you to differing viewpoints that improve collaboration and broaden your perspective.


Me: What did you find disappointing about the conference?

Alexus: From a little feedback from people, making sure that this is useful for graduate students. All the undergrads really seemed to enjoy it, but I want to make sure we are serving the general  UC Davis student body. So, making sure that the people we are inviting to lead our workshops are aware that we have grads and undergrads. [However,] I think Dr. Tull’s keynote speech and the panelists really addressed everyone.


To close the day, there was a career fair composed of several industry sponsors plus a few departments and campus resource centers. The room felt lively with conversation but I couldn’t help but notice the lack of diversity in the organizations attending – nearly all were engineering-based. I don’t happen to be personally interested in working in industry (although I did stop by the US Army Corps of Engineers booth to say hello since my dad and uncle worked for them for forty years) so I gravitated towards speaking with the representatives from the departments and resource centers. I mostly spent time speaking with the wonderful Nicole Rabaud, the Director of Graduate Academic Programs for the College of Biological Sciences. We spoke for nearly an hour about the state of graduate education (and more specifically my biophysics graduate group) and pathways for influence and reform. A few important reminders inspired by our conversation: (1) there are several exciting science policy fellowships opportunities in Sacramento including CCST and Capital Fellows, (2) Aggie Compass is available 24/7 for helping meet your basic needs, and (3) A “Buy Nothing” Facebook group exists for the Davis area. 


Me: Will you be doing it again next year? If so, what will you be changing?

Alexus: Yes, we are meeting [soon] to talk about next steps and plans for next year. We are looking to make DISC an actual organization. Having people focused just on DISC will be good. This year, we had the presidents of all of the organizations that were involved be the representatives on the committee. I was with ESTEME and also [focusing] on DISC as well, which means that often something else had to go. It’s not like we could drop off [the responsibility to] our clubs. So, for me, that was my research sometimes.


Overall, I really enjoyed the day and I look forward to attending this event next year. The DISC conference is a great celebration of the diversity of people in STEM at UC Davis and an important reminder about the value of community.


*There was a substitution not indicated on the website in the first panel of Blen Kelleni for Gwladys Keubon.

Maintaining Social Connections While Sheltering in Place

Hello there, from my apartment to yours.


As of this Thursday, the United States surpassed both China and Italy to become the new epicentre of the coronavirus pandemic. While the coronavirus continues to spread and millions of Americans self-isolate with no end in sight, many find themselves battling an inconspicuous enemy indoors: loneliness. The current practice of social distancing and sheltering in place is causing what some have termed a loneliness epidemic. As social creatures, this necessary practice can be difficult to sustain, since it prohibits us from interacting in person and holding social gatherings.


Loneliness also increases our risk for depression and anxiety, decreases our ability to respond to stress, and can weaken our immune systems, which effectively increases our susceptibility to contracting illnesses such as COVID-19. For these reasons, it’s important that we not only maintain calm and stop hoarding toilet paper and absurd amounts of perishable goods, but that we find unique ways of interacting and maintaining our social connections during these uncertain times. So, instead of panic scrolling through social media, consider listening to The Happiness Lab podcast by Yale professor Dr. Laurie Santos and learn how to recreate a sense of togetherness and keep calm in their Coronavirus bonus series.


Additionally, if you’re experiencing heightened levels of stress, anxiety or need assistance managing an anxiety disorder, you may find the following articles helpful:


https://www.helpguide.org/articles/anxiety/coronavirus-anxiety.htm 


Social distancing doesn’t have to mean social disengagement. Rather, this unique experience is an opportunity to come together and realize that, as cliche as it sounds, we’re all in this together. Afterall, it’s during times of crisis that it’s most important to remain connected.


  • Nina


Edited by Sydney Wyatt

Source suggested by Yulong Liu


For any content suggestions or general recommendations, please email to UCDBioScope@gmail.com and put science 2.0 in the title.


COVID-19: Keep Calm and Watch the Data

Written By: Ellen Osborn

Edited By: Jennifer Baily


Considering the massive media fever surrounding the current coronavirus outbreak, it might come as a surprise that most people are infected by one, if not multiple, coronaviruses during their lifetime. However, the current coronavirus outbreak is much more than just another flu.

Coronaviruses are a large family of viruses, of which several members cause mild to moderate upper-respiratory tract illnesses in humans, which account for 10% to 30% of these types of infections in adults. These endemic human coronaviruses (HCoVs) are considered inconsequential pathogens incapable of causing global epidemics. Until the early 2000s, HCoVs received little attention. 

Figure 1: The recent outbreaks of coronavirus-caused diseases known to infect humans (COVID-19 numbers are confirmed and as reported by China).

This changed when two novel coronaviruses (nCoVs) jumped from their animal reservoirs into humans and caused the Severe Acute Respiratory Syndrome (SARS) outbreak in 2002 and then Middle East Respiratory Syndrome (MERS) outbreak in 2012. Together, the SARS coronavirus (SARS-CoV) and MERS coronavirus (MERS-CoV) resulted in over ten thousand confirmed cases and 1640 deaths. The international panic brought about by these coronavirus outbreaks was crippling. In response, the World Health Organization (WHO) placed SARS-CoV and MERS-CoV on its Priority Pathogen list in an effort to galvanize research into nCoV biology as well as providing countermeasures to contain future outbreaks. 

Just two years later, an outbreak of an nCoV began in Wuhan, China. This nCoV is officially named SARS-CoV-2 due to preliminary analyses that identified genetic similarities to the 2002 SARS-CoV. Because the official name references SARS, the WHO shortly began referring to the virus as “the virus responsible for coronavirus disease 2019 ,” or COVID-19, in order to prevent unnecessary panic in populations affected by the 2002 SARS outbreak. 

The strong similarities between the COVID-19 coronavirus and SARS-CoV will undoubtedly assist in preventing and treating COVID-19. However, coronaviruses remain one of the least understood family of viruses due to their exceptionally large genome and proteome, and as a consequence, the complexity of the virus’ interactions with hosts. Here at the University of California, Davis, the California National Primate Research Center and Center for Immunology and Infection Diseases are working to establish a rhesus macaque model of COVID-19, which will be fundamental in understanding viral dissemination and age-related differences in COVID-19 disease progression. Additionally, the Interdisciplinary Research & Strategic Initiatives division of the Office of Research is coordinating the campus’ response to COVID-19 research funding opportunities and established the UC Davis COVID-19 Research Working Group to enable efficient sharing of resources, information, and to connect potential collaborates across UC Davis.

As an average news consumer, it has been difficult to pinpoint the exact level of concern COVID-19 merits. At the beginning of March, the WHO recorded 127 cases of COVID-19 in the United States – nine of which were fatal – and that community spread was beginning to occur in several locations. The CDC also received heavy blowback for an uncharacteristically slow response and subsequent release of a faulty test kit. Is the United States destined for an uncontrolled spread of coronavirus? Some are saying no and point to a more encouraging trend emerging from China in recent weeks. Dr. Bruce Aylward, an expert from the WHO, recently returned from a two-week trip to China to assess the state of the coronavirus outbreak after the country’s initial response garnered a storm of anger from its citizens and the rest of the world and relayed optimistic data. At the end of January, China was diagnosing over 2000 new cases per day with 31 provinces on red alert, but by early March, there were less than 100 new cases per day with 24 provinces down to yellow or green alert. Dr. Aylward says that this data is a good sign, and that with appropriate government-sanctioned public health measures and public cooperation, COVID-19 can still be contained globally, despite less than encouraging initial government responses.

Other world leaders and health professionals are suspect of China’s severe approach to contain COVID-19, questioning the effectiveness of essentially putting hundreds of millions of people, regardless of their health, on house arrest. Michael T. Osterholm, director of the Center of Infectious Disease Research and Policy at the University of Minnesota, wrote in a recent New York Times op-ed that although China did a remarkable job of slowing the progress of the outbreak, he is not convinced that it is sustainable and asks what others are asking: did the Chinese actually contain the virus, or have they just suppressed it? Only time will tell whether the virus will continue to spread when the Chinese people return to work and school. Even if the virus was successfully contained, it is hard to believe that China’s cordon sanitaire* could be reproducible in other countries that do not have the same surveillance infrastructure as China and whose citizens are not accustomed to authoritative government action.

Though the data are incomplete and public health measures in the United States have yet to be fully formed and delivered, it seems fair to say that social distancing is essential to contain COVID-19. Containment might require people to make sacrifices they are unaccustomed to, like working from home and canceling social events, but these are ultimately small sacrifices in the face of a global pandemic. In the meantime, instead of trying to gauge how concerned we should be from the headlines, it might be better to take the advice of New York Times reporter Donald McNield who has covered disease outbreaks since 2002: “don’t panic; watch the data.” As graduate students, we are uniquely qualified to practice this advice and communicate the data to our community.

Figure 2: Check Financial Times for the live version of this figure.

For our UC Davis readers, find campus updates here.

California state updates can be found here

CDC updates can be found here

WHO updates can be found here


Resources: 

The WHO daily situation reports. 

Cohen, J.; Powderly, WG. Infectious diseases. 2nd edn.. Mosby; New York: 2004.

de Wilde, Adriaan H., et al. “Host factors in coronavirus replication.” Roles of Host Gene and Non-coding RNA Expression in Virus Infection. Springer, Cham, 2017. 1-42.

de Wit, Emmie, et al. “SARS and MERS: recent insights into emerging coronaviruses.” Nature Reviews Microbiology 14.8 (2016): 523.

Li, Yan‐Chao, Wan‐Zhu Bai, and Tsutomu Hashikawa. “The neuroinvasive potential of SARS‐CoV2 may be at least partially responsible for the respiratory failure of COVID‐19 patients.” Journal of Medical Virology (2020).

Paules, Catharine I., Hilary D. Marston, and Anthony S. Fauci. “Coronavirus infections—more than just the common cold.” Jama 323.8 (2020): 707-708.

*A cordon sanitaire is the establishment of a quarantine zone where both sick and healthy people are not allowed to leave. 

Which Colors Should I Use? The Importance of Color Combinations in Scientific Figures

When creating scientific figures to best showcase your data, it is easy to overlook the importance of color scheme. When choosing color combinations, we tend to make our decisions predominately by what looks most appealing to our own eyes. However, it is crucial to remember that not everyone perceives color the same way. In the past, scientists often created fluorescent images and heatmaps using a green/red color scheme, making figures practically indiscernible by those with varying forms of colorblindness. The following article can help you learn to create illustrations that provide just as much contrast with arguably more visual appeal than a  green/red color arrangement, increasing the accessibility of your research. 

-Nina


Article on color-blindness and scientific figures. 

https://www.ascb.org/science-news/how-to-make-scientific-figures-accessible-to-readers-with-color-blindness/


A nifty web tool for helping you choose colorblind-friendly color schemes. Make sure to click on “colorblind safe” and “printer friendly” checkboxes. 

http://colorbrewer2.org/#type=diverging&scheme=PRGn&n=3


Edited by Keith Fraga

Source suggested by Yulong Liu


For any content suggestions or general recommendations, please email to UCDBioScope@gmail.com and put science 2.0 in the title.

The Science Behind Going Keto

Written By: Ross Wohlgemuth

Edited By: Sydney Wyatt


In the plethora of dieting options out there, it can be difficult to find the right one for you; sticking with it and seeing the results weeks or months later can be even more challenging. Whether it’s a traditional low-fat diet (LFD) or something more complex like intermittent fasting, each eating regime has its pros and cons that apply to different types of people with different goals in mind. Often, people choose the wrong diet or fail to stick with it, and do not reach their perceived goals. In worse cases, people may develop or worsen eating disorders by following strict diets. There is also a lot of misinformation about dieting, so it would be a shame if your 2020 resolution centered around a diet that has no scientific backing. Whatever the case may be, finding the right diet and sticking with it should be done with medical supervision.

Fig. 1. Sample ketogenic diet macronutrient proportions. This differs from the USDA recommendation by a large amount, especially in the carbohydrate category. Image from [3].

One diet in particular that is popular for weight loss and athletic performance is the ketogenic diet (KD, keto). The KD is similar to many diets in that it cuts carbs, almost to zero. While the USDA recommends that 45-60% of calories come from carbohydrates [1], the KD suggests less than 50g [2]. The macronutrient deficit is made up by an increase in fats, which make up around 70% of the caloric intake on keto [2].

The basis of the KD is that when your carbohydrate intake is low, your body can adapt by producing a new energy source called ketone bodies (KBs) [4]. KBs are made by mitochondria in the liver from fatty acid derived acetyl-CoA, and circulate throughout the body and even cross the blood-brain barrier to provide a source of energy to your cells [4,5] (Figure 2). Thus, even without consuming the recommended amount of carbohydrates, your body can still function just fine by running on fats—for the most part. The jury isn’t out on keto just yet, as some doctors and health organizations are still hesitant to proclaim as a safe way to eat.

For most people, one of the biggest factors in choosing a diet is how effective it is at promoting weight loss. In the case of the KD, science seems to support its weight loss promotion. In a meta-analysis [6] on thirteen studies involving long-term weight loss on a KD or a LFD, it found that five of the parameters tested differed between the KD and LFD groups, one of them being weight loss. They found that the average weight loss of the KD groups was 2 pounds more than that of the LFD groups. The study also found KD groups experienced decreases in blood triglycerides and diastolic blood pressure and increases in both high-density and low-density cholesterol (HDL, LDL).

Fig. 2. Schematic of ketone body (KB) formation. 3-Hydroxybutyrate, a KB, is produced from the oxidation of fatty acids, resulting in the production of acetyl CoA. Acetyl CoA is consequently converted into HMG-CoA and then to acetoacetate which is the precursor to 3-hydroxybutyrate. Figure and caption adapted from [5].

At first glance, this seems like a solid win for the KD since 3 out of the 5 changes are considered to represent indicators of health, but there are limitations to these studies to consider. The studies took place over a year or longer, and the provided counseling from a dietician varied between studies. In addition, participants were obese individuals with a mean age between 40 and 60. Further, the amount of carbohydrate intake per day by each participant was only reported to be in the keto range of 50g or less in one of the studies; the other studies either had a greater caloric proportion allocated to carbohydrates, or the value was not reported. Even greater concern is the high participant drop-out rate (15-85%) from the studies. This variation makes it hard to trust these studies, and the KD regime in general. Ultimately, the 2 pound difference between the keto and low-fat diets over a year’s time is not that much of a change, even if it is statistically significant. Thus, even though this study attempts to demonstrate that the KD is more effective in producing weight loss than the traditional LFD, there is still much to question as to the ability of participants to stay on the diet, and the relevancy of the results to a younger or more fit population.

Another factor to consider when choosing a diet is whether it improves your physical fitness or athletic performance. Under the scrutiny of scientific investigation, it seems that the KD may only benefit athleticism in certain cases. In a pilot study of five endurance athletes (four female and one male) between the ages of 49-55, a KD was maintained over 10 weeks of each athlete’s typical training schedule, consisting of 6-12 hours per week of cycling or running [7]. The athletes were tested for body composition and athletic ability at the end of the period, and were also asked to give commentary about the experiences they felt during their time on the diet.

Fig. 3. Weight loss, time to exhaustion (TTE), and ventilatory threshold (VT2) in endurance athletes from [6].

The researchers found that the body composition of the athletes improved significantly, with an average weight loss of almost 9 pounds and a significant loss in fat mass as measured through several skin folds (Figure 3). This positive weight loss was not accompanied by positive results in performance however, with declines in VO2 Max, peak power, and ventilatory threshold (Figure 3). Some athletes even reported negative experiences toward the beginning of the study, including complaints of fatigue or irritability, however, there were more positive experiences reported like feeling healthier or enjoying the weight loss by the end.

The researchers concluded that although the KD was effective in improving body composition and weight, it was not successful in improving endurance performance. They hypothesized that the lack of athletic improvement was due to lower rates of glycogenic metabolism (metabolism which uses glucose as the primary substrate), which could hinder performance in high intensity exercise. This could be due to lower blood insulin downregulating pyruvate dehydrogenase, an enzyme necessary in linking the glycolytic pathway in the cytosol to the Krebs cycle in the mitochondria [8]. The researchers also thought that liver glycogenolysis (breakdown of glycogen) could be influenced by dietary intake of carbs while gluconeogenesis (the process of making new glucose from lactate, glycerol, and other substrates) remained constant during KD [9]. Whatever the case may be, it seems that using KBs as a metabolic substrate attenuates the athletic ability of the endurance athletes in maximal intensity efforts.

In another study that compared the effects of the KD and traditional western diet (WD) on strength performance in nine elite male gymnasts around the age of 21 [10], researchers found that 30 days of the KD produced better changes in body composition than the WD, but not in strength or performance. Since the athlete’s training regimes were consistent throughout the year, each participant was able to undergo 30 days of the KD and 30 days of the WD in order to pair the two treatments for comparison (a 3 month gap was used between the two dieting periods). The results showed that 30 days of the KD led to an average weight loss of 3.5 lbs and a fat mass reduction of 4.2 lbs. This translates to a change in body fat percentage of 2.6% and an increase in lean mass percentage by a similar degree. Nevertheless, these underlying changes in body composition did not affect the athlete’s muscle mass or their athletic ability. There were no significant changes in either parameters after the KD or WD regimes. The investigators attributed the weight loss to fullness from adequate protein consumption, a greater ratio of fat breakdown to fat synthesis, lowered resting respiratory exchange ratio (meaning the predominant fuel during rest was fat), and elevated metabolism from gluconeogenesis and the thermic effect of proteins [11]. They also stated that increasing muscle mass during the KD is difficult since blood insulin levels are so low, which attenuates the muscle growth pathway via IGF-1, mTOR, and AKT (Figure 4) [12]. Thus, maintaining muscle mass during the KD is a more reasonable and attainable goal than gaining mass. With that in mind, the relevance of the KD to athletic performance becomes more important to athletes whose sport involves weight classes such as boxing. Competitors who desire to maintain muscle mass and strength while trying to lose fat to fit into a lower weight class may reasonably benefit from short term use of the KD. With this in mind, the KD seems like a reasonable option for a specific niche of athletes who may stand to gain (or lose) from periodic keto use.

Fig. 4. The signaling pathway for muscle hypertrophy relies on insulin and IGF-1 signaling, which leads to the increase in phosphorylation of AKT and the activation of mTOR. mTOR activation leads to downstream effects ultimately resulting in muscle hypertrophy (muscle growth). Figure taken and caption adapted from [12].

After looking at the KD as a weight loss promoter and performance enhancer, it certainly has its fair share of pros and cons. As far as diet commitment, the KD seems to be difficult in the first few weeks but easier as it continues. Not only were there great proportions of participants who dropped out from the studies involved in the meta-analysis, but the experiences reported from the endurance study show that the KD can be difficult and perhaps even miserable in the beginning. In addition, the carbohydrate caloric contents of the studies in the meta-analysis were not even low enough to be considered “keto” by the latter two studies addressed [7,10], so adherence to the KD by non-athletes or those who have less dietary or physical motivation may be called into question.

In the studies on endurance and strength athletes, the net carbs consumed per day were well below the 50g mark, with around 10-35g in the endurance study and 22g in the strength one. These bode well with the body composition and weight loss observed in the short amount of time the KD was followed compared to the long-term studies in the meta-analysis. Even though the meta-analysis showed that the KD had better weight loss effects than the LFD, the amount of weight lost in the 12-month period was unimpressive compared to the short-term studies. This may have to do with the demographics of each population, as the long-term studies were done on older, obese individuals and the short ones done on active people of various ages. This highlights the confounding effect of lifestyle and level of exercise to dietary studies of the KD. It is virtually undeniable that diet and exercise are the cornerstones of weight loss programs, and the combination is more effective than either alone.

The KD presents some promise to those looking to lose weight who are also generally active on a weekly basis. Although it may not be useful in improving athletic performance, it is remarkably beneficial to metabolic health when used safely and correctly. Again, any new diet program you want to try should be discussed thoroughly with a qualified physician or dietician. Given the scientific literature on the KD, I would say KD shows promise for a certain niche of people who are focused on losing weight.

Citations

  1. Dietary Guidelines for Americans. 2010. USDA, USDHHS.
  2. Gunnars, Kris. (04 January 2019). 5 Most Common Low-Carb Mistakes (And How to Avoid Them). Healthline.com 
  3. Ketogenic diet breakdown. Perfectketo.com
  4. Pinckaers, P.J.M., Churchward-Venne, T.A., Bailey, D., van Loon, L.J.C. (2017) Ketone Bodies and Exercise Performance: The Next Magic Bullet or Merely Hype? Sports Med. 47:383-391. doi:10.1007/s40279-016-0577-y
  5. Watanabe, Shaw & Hirakawa, Azusa & Aoe, Seiichiro & Fukuda, Kazunori & Muneta, Tetsuo. (2016). Basic Ketone Engine and Booster Glucose Engine for Energy Production. Diabetes Research – Open Journal. 2. 14-23. 10.17140/DROJ-2-125.
  6. Bueno, Nassib Bezerra, et al. “Very-Low-Carbohydrate Ketogenic Diet v. Low-Fat Diet for Long-Term Weight Loss: a Meta-Analysis of Randomised Controlled Trials.” British Journal of Nutrition, vol. 110, no. 7, 2013, pp. 1178–1187., doi:10.1017/S0007114513000548.
  7. Zinn, C., Wood, M., Williden, M., Chatterton, S., Maunder, E. (2017) Ketogenic diet benefits body composition and well-being but not performance in a pilot case study of New Zealand endurance athletes. Journal of the International Society of Sports Nutrition. 14(22) doi:10.1186/s12970-017-0180-0
  8. Peters, S.J., LeBlanc, P.J. (2004) Metabolic aspects of low carbohydrate diets and exercise. Nutrition and Metabolism. 1(1):7. doi: 10.1186/1743-7075-1-7.
  9. Webster, C.C., et. al. (2016) Gluconeogenesis during endurance exercise in cyclists habituated to a long-term low carbohydrate high-fat diet. The Journal of Physiology. 594(15): 4389-4405. doi:10.1113/JP271934.
  10. Paoli, A., Grimaldi, K., D’Agostino, D., Cenci, L., Moro, T., Bianco, A., Palma, A. (2012) Ketogenic diet does not affect strength performance in elite artistic gymnasts. Journal of the Society of Sports Nutrition. 9(34)
  11. Paoli A., Canato M., Toniolo L., Bargossi A.M., Neri M., Mediati M., Alesso D., Sanna G., Grimaldi K.A., Fazzari A.L., Bianco A. (2011) The ketogenic diet: an underappreciated therapeutic option? La Clinica Terapeutica. 162:e145–e153.
  12.  Egerman, M.A., Glass, D.J. (2014) Signaling pathways controlling skeletal muscle mass. Crit Rev Biochem Mol Biol. 49(1): 59-68. doi:10.3109/10409238.2013.857291


Working Distractions: the cost and ways to overcome  

Written By: Ellen Osborn

Edited By: Emily Cartwright and Anna Feitzinger


At any given moment, there are multiple, maybe even dozens, of things that demand our attention as graduate students. It could be the unread emails that need to be responded to, the experiment that needs to be planned, the papers sitting at home that need to be graded, the grant that needs to be written, and the list goes on. Whether it is an effect of our world moving faster, or a consequence of ourselves growing older, it is becoming increasingly more difficult to focus on a single task and ignore incessant distractions. 


According to the 2018 Workplace Distraction Report published by the online learning company Udemy, Millennials and Gen Z were found to be the most distracted generations; 74% of surveyed individuals described themselves as distracted at work. Millennials and Gen Z are distracted at school as well as work: a cohort of university students were found to focus on a single task for only 6 minutes before succumbing to a distraction (Rosen et al., 2013). 


While this might not come as a surprise, our brains do not do their best work when we are distracted. Business professor Sophie Leroy coined the term attention residue, defined as the attention that remains with an initial task even when an individual has transitioned to a second task. In experiments that involved giving participants a cognitively demanding task to complete, such as solving a complex puzzle, it was found that for those participants that were briefly distracted, even by just glancing up at a picture, their performance dropped significantly when returning to the original task. Just by changing their context very briefly, the attention residue seized by the distraction prevented individuals from performing at their best, and not just momentarily. It took some time before the attention residue fully cleared and individuals were again fully focused on the task at hand. Dr. Leroy’s work echoes the findings from a University of California, Irvine study where researchers shadowed individuals while at work and found that it took an average of 23 minutes for those individuals to get back to an initial task after being abruptly interrupted by either a telephone call or text message.


Cal Newport, professor and author of the cult book “Deep Work: Rules for Focused Success In a Distracted World,” makes the conclusion that by changing our cognitive context frequently at work, we are consistently building up attention residues that prevent us from ever truly focusing on a single task. That is, every time we take a quick glance at our inbox or attempt to multitask, we do so at the cost of performance. And while some can recognize this sacrifice of performance for distraction and address it with a casual “Well I guess I should be less distracted”, for those that rely on their brains to make a living (like graduate students), there should be more urgent concern. 


So what are some ways we can set aside everyday distractions in favor of developing more productive work habits? Pete Leibman, creator of StrongerHabits.com and bestselling author, promotes three basic steps to minimize attention residue throughout the day. First, instead of jumping from task to task rapidly during the day, try to focus on a single project per day. Or, if that is not possible, dedicate the morning to work on one project, and then focus on a second project in the afternoon. This removes the largest cause of attention residue: multitasking between several unrelated projects. Second, because it can be overwhelming and demotivating to try to tackle a whole project in a single day, try breaking the project down into unambiguous pieces that can be completed in approximately 60 minutes. This practice will minimize the attention residue associated with working on related tasks at the same time, which is a sneaky form of multitasking. Third, plan to take short deliberate breaks throughout the day, especially when transitioning between tasks. Just like cleaning a paint brush before dipping into a new color, being intentional about taking short breaks in between tasks removes much of the attention residue that is stuck on the previous task. 


Some other practical tips offered up by professionals in the business of decreasing distractions: for one day, write down everything you do, any task, both major and minor (from checking Facebook to giving lab meeting). For each item you listed, ask yourself if that task is a distraction: something that kept you from focusing on the most important tasks in your day. If it is, intentionally plan your day so that you are only doing those distraction tasks during a defined block of time so they do not interfere with your more important tasks. Also, to prevent being caught wondering what task you should be focused on, plan your day the afternoon before (not waiting until the end of the day when you are less likely to do it). And one final tip, which may be the simplest but the most difficult: while at work, keep your phone silenced and tucked away where it cannot be seen or reached, eliminating the temptation to indulge in easy distractions. 


Related media to check out: this TedTalk for more on strategies to manage addictive distractions, and this NPR podcast with Cal Newport on deep work. 


Sources (in order of appearance): 

Udemy for Business. (2018). 2018 Workplace Distraction Report

Rosen, Larry D., L. Mark Carrier, and Nancy A. Cheever. “Facebook and texting made me do it: Media-induced task-switching while studying.” Computers in Human Behavior 29.3 (2013): 948-958.

Leroy, Sophie. “Why is it so hard to do my work? The challenge of attention residue when switching between work tasks.” Organizational Behavior and Human Decision Processes 109.2 (2009): 168-181.

Mark, Gloria, Daniela Gudith, and Ulrich Klocke. “The cost of interrupted work: more speed and stress.” Proceedings of the SIGCHI conference on Human Factors in Computing Systems. ACM, 2008.

“You 2.0: Deep Work.” Hidden Brain, NPR, 27 Aug. 2019, https://www.npr.org/transcripts/754336716.

Leibman, Pete. “Attention Residue: The Costly Side Effect of Switching Tasks.” StrongerHabits.com, 21 Mar. 2019, https://strongerhabits.com/attention-residue/.

Science communication for the middle ground

Written By: Will Louie

Edited By: Nina Sibonae Cueva

It is flu season, so I hope you have all gotten your flu shots! Vaccinations are arguably one of the most game-changing medical achievements of human civilization. Developed countries enjoy the eradication and suppression of some of the deadliest viral and bacterial diseases. However, since the publication of the original study fraudulently linking the Mumps, Measles, Rubella (MMR) vaccine to autism, the anti-vax movement is on the rise in the United States. And while scientists focus on the black-and-white of whether to vaccinate when debunking this claim, vaccine-hesitant people are still left in the middle. This group does not flat out reject vaccines, but are either fearful about the side effects, considering alternative vaccination schedules, or just distrustful of medicine in general. It is critical that we as scientists empathize and address the sources of hesitancy, a phenomenon that describes reluctance but not complete opposition to vaccination.


Many infectious diseases that terrorized our ancestors are but a memory thanks to mass vaccination. According to the Center for Disease Control and Prevention (CDC), the incidence of many infectious diseases have dropped by over 90% since the implementation of quality-controlled vaccines. Globally eradicating smallpox in 1980 was only possible through mass vaccination. Famously, Jonas Salk’s first successful polio vaccine in 1955 was immensely successful in pioneering mass vaccination, as millions of American families volunteered their children in Salk’s government-funded vaccine trials. Parents truly felt they contributed to a greater good, and the rapid transition from fears of losing their children to the disease within a single afternoon to near eradication of polio incidence highlighted an immense payoff in trust of a government program. Following worldwide administration, polio has been nearly eradicated, with sporadic transmission confined to inaccessible regions of Pakistan and Afghanistan. Despite these success stories, vaccine hesitancy has persisted, and understanding the perspective of those who are vaccine hesitant is imperative to improving our communication with the public.


Fears about autism


The most resilient debunked argument against vaccinating children is the fear that vaccines cause autism. Although the study was retracted, the damage was already done: this argument lingers among social media groups and anti-vax blogs. More worrisome is not that people still believe this unsupported causal relationship, but that anti-vaxxers prioritize preventing autism over preventing potentially deadly diseases. The fear is unfounded and counters collective efforts to destigmatize physical and mental disabilities. While the universal consensus among scientists is that no causation between vaccines and autism exists, it is uncertain whether this rebuttal alone is sufficient. Many vaccine-hesitant parents are still unsure whether this autism link is truly debunked, thanks to the mass amounts of information and disinformation circulating on the internet. We should also delineate the differences in health outcomes between autism spectrum and deadly infectious diseases. Even if this were true, the benefits outweigh the risks, and marginalizing those who are actually on the spectrum is not helpful. As scientists, we must improve our communication to clearly share the benefits and real risks of vaccination without alienating an already marginalized population. Shifting our focus from sole denial of MMR-autism causation to an emphasis that the benefits of MMR protection are worth the risks of side effects, addresses parental concerns for their children’s health in a non-judgemental manner.


Fears about government ethics and transparency


We all have a favorite conspiracy theory; I love the claim that “pigeons are not birds but actually government surveillance drones implemented to spy on urban civilian life” (citation not needed). Likewise, there is no shortage of conspiracy theories regarding vaccines. Moreover, there is a striking overlap between people who believe in conspiracy theories and those who are skeptical of vaccines. However, one cannot help being sympathetic to groups who are distrustful of government. After all, the U.S. government’s track record for medical ethics and transparency has been less than stellar. From the Tuskegee syphilis experiments targeting African American males on the domestic front to the CIA’s fake vaccination program in Pakistan as a cover for hunting Osama bin Laden on the international front, it is no surprise that many people are skeptical of government-mandated vaccine compliance. While there is still a giant chasm between outlandish chemtrail conspiracies and a real concern over government regulation or deregulation of vaccine administration, we need better ways to communicate the differences. Those who are vaccine-hesitant often struggle to separate distrust in the business practices of our corporate overlords from distrust in the science itself. Public health professionals and medical researchers need to bolster efforts at communicating the risks, benefits, and evidence for vaccines in a transparent and assuring manner. Most importantly, however, is the need to repair trust between the government and the people, a problem that transcends the anti-vax movement.


Fears about Big Pharma


Similar to the distrust in government is the distrust in companies that profit from vaccine development and distribution. It is easy to paint the pharmaceutical industry as the villain, because it is true in many cases. Examples of corporate greed taking priority over civilian health are all too numerous: former Turing CEO Mark Shkreli’s 5000% markup on the drug Daraprim (arguably a catalyst for discovery of the even more sinister predatory price gouging by Valeant Pharmaceuticals); Purdue Pharma’s role in fueling the opioid crisis; and Bayer knowingly selling HIV-tainted products to developing countries. As a self-proclaimed jaded millennial, I am not surprised that there are people, paranoid or misinformed, who see vaccines as just another case of Big Pharma capitalizing on a medical necessity to maximize profits. But Big Pharma generally doesn’t profit from vaccines. The cost of an annual flu shot ranges from $0 to $50 depending on your medical provider, while other vaccines like the intravenous polio vaccine are being given to children in developing countries for free, because even they understand the long term benefits of mass vaccination. The scientific community must separate fact from fiction when it comes to Big Pharma’s games, and effectively communicate that getting vaccinated doesn’t really affect their bottom line.


How do we come in?


It is important to note that anti-vaxxers are a vocal minority group. It is unlikely that any amount of evidence or communication will convince those deep in the anti-vax camp, but we can help those who are undecided. The vast majority of Americans do support vaccines and vaccination rates in the U.S. are still high, but they can be improved. Recent years have seen a rise in measles cases, traceable to anti-vax communities. While measles vaccination rates in the U.S. have remained at approximately 91% from 2013 to 2017, the required vaccination rates to confer herd immunity to measles has been estimated to be >95%. Importantly, most parents just want what is best for their kids. However, when they decide not to vaccinate their children, they are not just making a decision for their children, they are making a decision for their community. Immunocompromised individuals as well as children too young to get the particular vaccine rely entirely on herd immunity,. Thus vaccination rates for highly contagious measles need to be higher to provide effective herd immunity. As scientists, we can understand these statistics and translate them to the vaccine-hesitant group for the benefit of all.

Facts, evidence, and rationalism are the bread and butter of scientists, but this does not always translate well to the layperson. As seen in segments of Last Week Tonight with John Oliver and Full Frontal with Samantha Bee, comedy is a great way to relay information about vaccines. This is accompanied by the realization that emotional anecdotes about children who suffer from vaccine-preventable diseases connect to parents much more effectively than do facts and figures. As much as I hate to admit it, my beautiful PCR gels and stunning figures of antibody titers are less impactful than a commercial for polio vaccination showing children confined to the Iron Lung (picture below) after being afflicted with polio. As scientists, it is difficult to leave the bench behind and participate in activism and communication. It is a constant struggle to communicate science to the public in an amicable and informative manner. Rather than dismiss all concerns about vaccines, we should constantly improve our communication to be rational but relatable, confident but approachable, stern but empathetic. Fighting vaccine hesitancy is an uphill but winnable fight that will pay off with improved means of scientific communication.

Smithsonian Magazine, 1952

Page 2 of 3

Powered by WordPress & Theme by Anders Norén