Author: Anna Feitzinger
Editors: Hongyan Hao, Sharon Lee, Keith Fraga
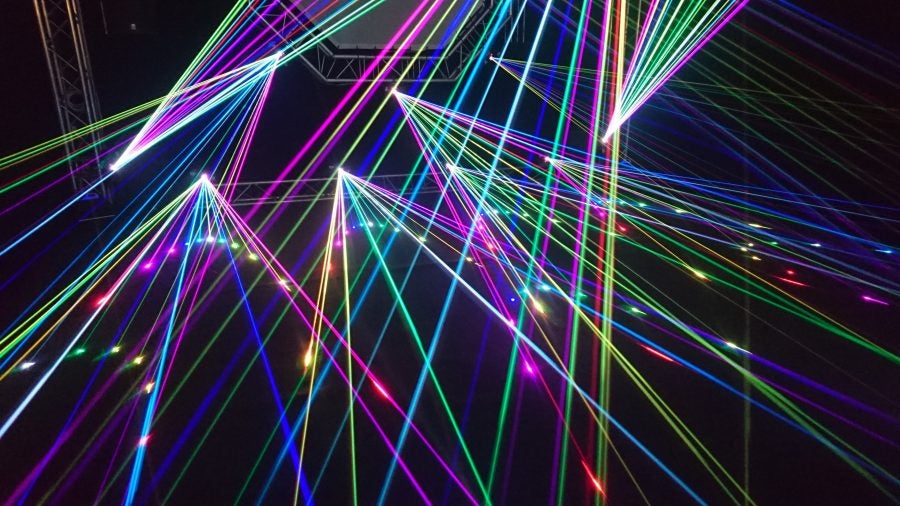
At first glance, science and art may appear to be two areas of human activity that could not be more distantly related. I’d like to dismantle this idea of scientists and artists and explore the qualities shared by both. Neon color tube racks and primary-colored pipette tip boxes are some of the basics that are scattered about the biologist’s benchtop. Biologists often visualize the microscopic world using dyes or fluorescent molecules and lasers of various wavelengths of light. The result is an image (or video) of colorful molecules whose arrangement depends on the particular cellular landscape and whose interpretation is up to the scientist. In fact, the first image that surfaces when searching “immunostaining” resembles that of a Paul Jackson Pollock painting (Figure 1).
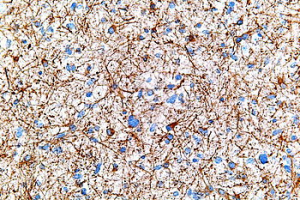
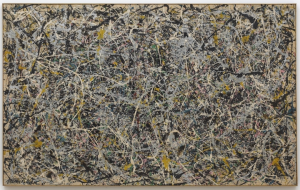
Figure 1. Left: Immunostained section of brain tumor in Wikipedia, The Free Encyclopedia. Right: Number 1, 1949 by Jackson Pollock.
The history of science is full of art. Before cameras, scientists had to draw out their discoveries as lens’ became better at high levels of magnification. Inspired by the drawings in Robert Hooke’s Micrographia, the tradesman Antony van Leeuwenhoek learned how to grind lenses so to take up the hobby of microscopy. He made the most powerful lenses of the time and consequently discovered bacteria, protists, sperm cells, blood cells, rotifers and more before his death in 1723. [1] Although he had no formal higher education, he is now considered the Father of Microbiology.
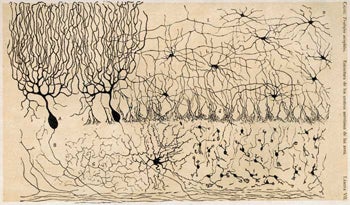
Another unlikely scientist, Santiago Ramón y Cajal, was a rebellious and anti-authoritarian youngster who was said to have been imprisoned at the age of eleven in 1863 for destruction using a homemade cannon [2]. An avid painter, Santiago’s illustrations of brain and neural anatomy have become iconic. Considered the Father of Modern Neuroscience he postulated the neuron theory; the law of the dynamic polarization of the neuron and discovered the axonal growth cone.
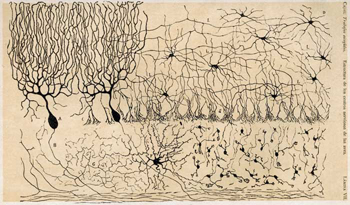
Figure 2: A depiction of neurons in the cerebellum by Santiago Ramón y Cajal
Visual artists confined to physical media must discover the nature of their medium. Different techniques require different media and skills. For instance, one must decide the dilution factor of oil paint to linseed oil or acrylic paint to water in order to create a preferred texture and consistency. Screen printers and photographers must learn the properties of the light sensitive emulsions and films with which they work. Musicians become familiar with the sound waves they produce and modulate. Much like scientists mixing reagents in the lab, artists have an array of media used for experimentation.
Scientists and artists both have a need to share their perceptions of the universe which drives dedication, patience and persistence. Both have visions which they spend years perfecting and require creativity for success. Both get feedback from their peers and share their work with the community. Scientists share their work at conferences and artists do so in galleries or on stage. Occasionally, these two worlds collide. Last year marks the twenty year anniversary of the “Worm Art Show” which was started in 1997 by Ahna Skop at the International C. elegans conference. Works presented at the very first show included the C. elegans genome sandblasted onto a piece of driftwood and a wooden construction of the C.elegans vulva [3]. The American Society of Microbiology now hosts an annual Agar Art competition. This years first place piece, “The battle of winter and spring” features a stunning portrait of two contrasting figures made using colored microbes resistant to different antibiotics on a plate of agar.
Artists and scientists share a common thread historically, and each rely on one another in the modern world. Some recent collaborations include the turning of data into sound, called sonification. Mark Ballorad of Pennsylvania State University in State College has received two $50,000 grants for a project aiding marine biologists in translating data from the deep ocean into sound. Being able to listen to large data sets allows for an entirely different perspective that may not be captured by more conventional visualization methods. A recent publication by a music professor and chemical biologist explore how turning protein sequence and structural information into melodies can facilitate analysis.
Here at UC Davis the Department of Design hosts the LASER Series: conversations in art and science. Each LASER event has four presentations from four different disciplines as unrelated as possible. These talks are meant to facilitate interdisciplinary conversations between artists, scientists and generalists. The seminar is part of an international speaker series, all which are documented and accessible online. Another Art/Science initiative on campus is the Art/Science Fusion program which aims to bring creative energies from the arts and sciences to foster innovation.
[1] Kruif PD (1926) Microbe Hunters. Transactions of the American Microscopical Society 45(3):259.
[2] McMenemey, W. H., M.D. (1952). Section of Pathology (Vol. 46). Proceedings of the Royal Society of Medicine.
For updated information on the LASER series at UCD: https://www.facebook.com/laser.ucd
Additional articles on this topic:
https://www.forbes.com/sites/quora/2016/03/16/why-art-and-science-are-more-closely-related-than-you-think/
https://www.ebsco.com/blog/article/the-steamy-relationship-between-art-and-science
https://cosmosmagazine.com/society/when-arts-and-science-collide